Lesson 26 of 32 · ~22 min
Packet Capture and Traffic Inspection
Filters, baselines, unusual traffic.
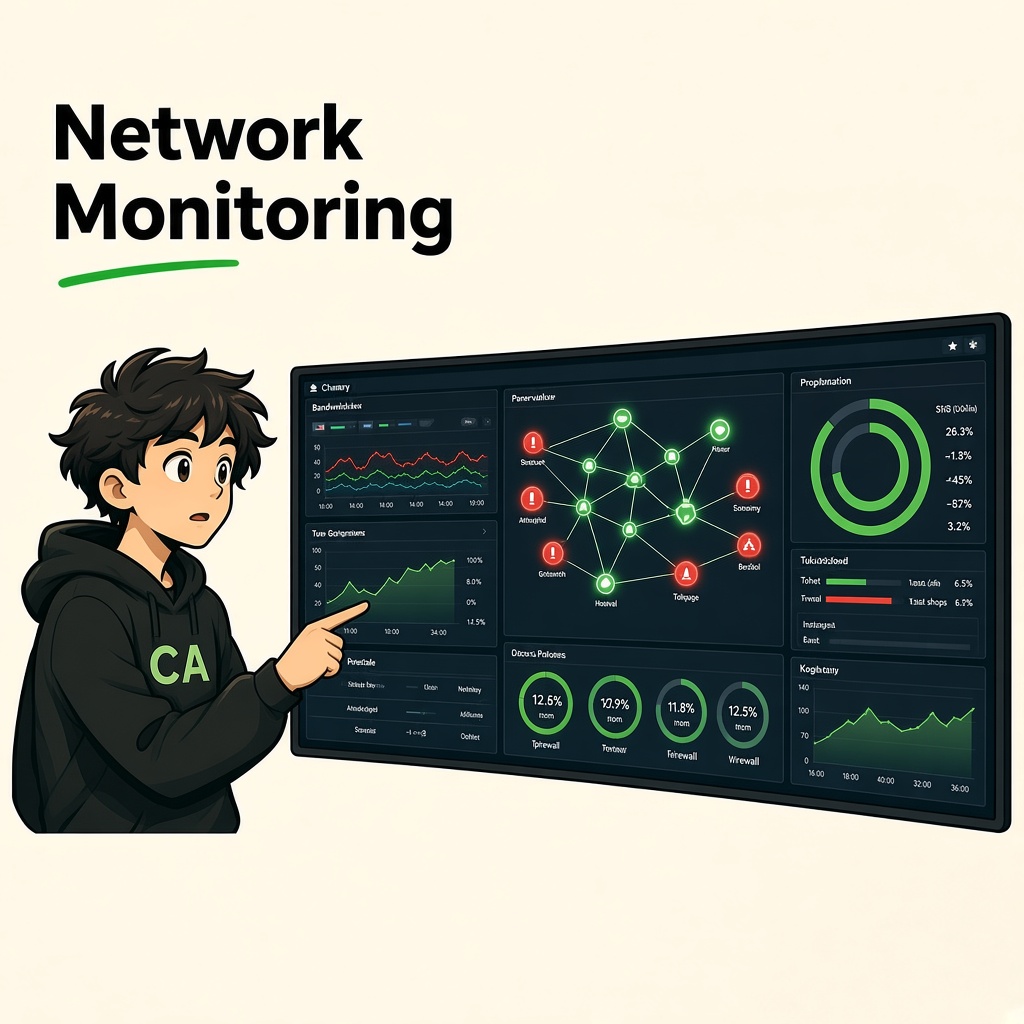
Network Monitoring and Packet Analysis
Wireshark, Filters, Baselines, NetFlow, and Unusual Traffic
Course: Network Security
Level: Beginner
Module: Network Security and Monitoring
Estimated Duration: 100–120 minutes
1. Learning Objectives
By the end of this lesson, you will be able to:
- Explain network monitoring and packet analysis.
- Understand how network packets carry information.
- Differentiate packet capture from traffic-flow monitoring.
- Understand network traffic baselines.
- Navigate Wireshark and interpret packet details.
- Differentiate capture filters and display filters.
- Analyze TCP three-way handshakes.
- Inspect DNS queries and responses.
- Understand HTTP communication and TLS metadata.
- Read basic network logs.
- Explain NetFlow and IPFIX.
- Identify unusual network traffic patterns.
- Prepare a basic network traffic investigation report.
2. What Is Network Monitoring?
Network monitoring is the continuous observation of network devices, connections, traffic, and performance to understand how a network operates and identify possible problems or security threats.
Organizations monitor their networks to understand:
- Which devices are communicating.
- Which services are being accessed.
- How much traffic is flowing.
- Whether network performance is normal.
- Whether suspicious connections are occurring.
- Whether devices are communicating with unexpected destinations.
- Whether an attack or configuration problem is affecting the network.
Real-world example
Imagine CYNARKS is monitoring a company's network with:
- 100 employee computers.
- 10 servers.
- 5 network switches.
- 2 firewalls.
- 1 database server.
- 1 monitoring server.
A security analyst notices that an employee computer normally communicates with internal business applications but suddenly begins making frequent connections to an unfamiliar external destination.
Network monitoring helps the analyst investigate:
- Which device generated the traffic?
- What destination did it contact?
- Which protocol and port were used?
- How frequently did the connections occur?
- Was data transferred?
- Is this behavior expected?
3. What Is a Network Packet?
A packet is a formatted unit of data carried across a network.
When an application sends information, the data is encapsulated with protocol information as it moves through the networking layers.
For example, when a computer accesses a website:
- The application creates an HTTP request.
- HTTP data is carried using TCP in a typical HTTP/1.1 or HTTP/2 connection.
- TCP segments are encapsulated inside IP packets.
- IP packets are carried inside Ethernet or another link-layer frame.
- The network forwards the data toward its destination.
This is called encapsulation.
<AsyncImage query="network packet encapsulation application HTTP TCP IP Ethernet frame headers payload diagram" aspectRatio="16:9" width="100%"/>3.1 Important Packet Fields
| Field | Meaning |
|---|---|
| Source MAC | Sender's link-layer address |
| Destination MAC | Receiver's link-layer address |
| Source IP | Sender's IP address |
| Destination IP | Receiver's IP address |
| Source Port | Sender's transport-layer port |
| Destination Port | Destination application port |
| Protocol | Communication protocol |
| Length | Packet or frame length |
| Flags | Protocol-specific control information |
| Payload | Carried application or protocol data |
Important: The exact fields depend on the protocol. Not every packet contains all the fields listed above.
3.2 Packet vs Frame vs Segment
These terms describe data at different networking layers.
| Term | Common Layer | Meaning |
|---|---|---|
| Frame | Data Link | Link-layer data unit |
| Packet | Network | IP-layer data unit |
| Segment | Transport | TCP data unit |
| Datagram | Transport | Commonly used for UDP data |
A packet capture tool may display several of these layers together.
4. What Is Packet Analysis?
Packet analysis is the process of examining captured network traffic to understand communication between devices.
It helps security professionals investigate:
- Connection failures.
- DNS problems.
- Suspicious network communication.
- Unexpected protocols.
- Data transfer behavior.
- TCP retransmissions.
- Network latency.
- Potential security incidents.
Example
An employee reports that an internal application is slow.
A network analyst captures authorized traffic and observes:
- The client sends a TCP SYN.
- The server responds slowly.
- Multiple retransmissions occur.
- The connection takes longer than expected.
This may indicate packet loss, congestion, server issues, or another network problem.
Packet analysis helps narrow down the cause, but additional system and application logs may be required.
5. What Is a Network Traffic Baseline?
A network traffic baseline describes normal network behavior over a representative period.
It helps security teams understand what is expected so they can identify deviations.
Example
A company's normal traffic may look like this:
| Activity | Typical Behavior |
|---|---|
| Employee web browsing | HTTPS connections |
| DNS | Queries to approved resolvers |
| File sharing | SMB within approved internal networks |
| Approved mail services | |
| Backups | Scheduled transfers at night |
| NTP | Periodic time synchronization |
| Server monitoring | Regular monitoring requests |
If a server normally transfers a small amount of data but suddenly sends a very large amount to an unfamiliar external destination, the activity deserves investigation.
5.1 Types of Baselines
Traffic volume baseline
Measures normal data transfer volume.
Connection baseline
Measures normal connection counts and patterns.
Protocol baseline
Identifies protocols commonly used by devices.
Destination baseline
Identifies normal internal and external communication destinations.
Time-based baseline
Identifies expected activity during business hours, nights, weekends, and scheduled maintenance.
5.2 Why Are Baselines Important?
Without a baseline, analysts may struggle to distinguish:
- Normal backups from unusual data transfers.
- Legitimate software updates from suspicious downloads.
- Normal DNS activity from abnormal DNS patterns.
- Expected traffic bursts from possible denial-of-service activity.
5.3 Building a Baseline
- Identify critical network devices.
- Collect traffic information over a representative period.
- Record common protocols and destinations.
- Measure typical connection volumes.
- Document scheduled business activity.
- Identify unusual but legitimate patterns.
- Review and update the baseline regularly.
Important: A baseline is not a fixed definition of safe activity. Normal business behavior changes, and attackers may sometimes imitate legitimate traffic.
6. Introduction to Wireshark
Wireshark is a widely used network protocol analyzer.
It captures and displays network packets so analysts can inspect communication details.
It is commonly used for:
- Network troubleshooting.
- Protocol analysis.
- Security investigations.
- Application communication analysis.
- DNS troubleshooting.
- TCP troubleshooting.
- Training and education.
6.1 What Can Wireshark Show?
Wireshark can display:
- Source and destination addresses.
- Protocol names.
- Ports.
- Packet lengths.
- TCP flags.
- DNS queries and responses.
- HTTP metadata.
- TLS handshake information.
- Packet timing.
- Retransmissions and errors.
What is visible depends on the traffic, capture location, encryption, and available protocol information.
7. Understanding the Wireshark Interface
The main interface contains several important areas.
7.1 Interface Selection
This area allows you to choose the network interface to capture.
Examples:
- Ethernet.
- Wi-Fi.
- Loopback.
- Virtual network interfaces.
Choose the interface that carries the traffic you are authorized to inspect.
7.2 Packet List Pane
Displays captured packets in rows.
Common columns include:
| Column | Meaning |
|---|---|
| No. | Packet number |
| Time | Capture timestamp |
| Source | Source address |
| Destination | Destination address |
| Protocol | Detected protocol |
| Length | Packet length |
| Info | Brief packet description |
7.3 Packet Details Pane
Displays the selected packet's protocol structure.
For example:
- Ethernet II.
- IPv4 or IPv6.
- TCP or UDP.
- DNS.
- HTTP.
- TLS.
You can expand individual sections to inspect fields.
7.4 Packet Bytes Pane
Displays packet bytes in hexadecimal and ASCII representation where applicable.
This is useful for low-level protocol analysis.
Important: Encrypted application payloads generally cannot be interpreted as readable application content without appropriate authorized decryption material.
8. Packet Capture Filters
A capture filter determines which packets Wireshark captures.
Capture filters are applied before packets are recorded.
Wireshark uses the Berkeley Packet Filter (BPF) syntax for capture filters.
8.1 Common Capture Filters
Capture all traffic to or from a specific host:
host 192.168.1.10
Capture traffic from a specific source:
src host 192.168.1.10
Capture traffic to a specific destination:
dst host 192.168.1.20
Capture traffic on a specific network:
net 192.168.1.0/24
Capture TCP traffic:
tcp
Capture UDP traffic:
udp
Capture DNS traffic:
port 53
Capture HTTP traffic on its traditional port:
tcp port 80
Capture HTTPS traffic on its traditional port:
tcp port 443
Capture SSH traffic on its traditional port:
tcp port 22
Capture TCP traffic to or from a host:
tcp and host 192.168.1.10
8.2 Combining Capture Filters
Use and, or, and not.
Example:
tcp and port 443
This captures TCP traffic associated with port 443.
Example:
host 192.168.1.10 and not port 22
This captures traffic involving the host except traffic associated with port 22.
Important: Capture filters reduce the traffic recorded. If you exclude relevant packets at capture time, they will not be available later for analysis.
9. Display Filters
A display filter controls which already captured packets are visible.
Unlike capture filters, display filters do not remove packets from the capture file.
Wireshark uses its own display-filter language.
9.1 Common Display Filters
Show all DNS packets:
dns
Show TCP traffic:
tcp
Show UDP traffic:
udp
Show HTTP traffic:
http
Show TLS traffic:
tls
Show packets involving a specific IP:
ip.addr == 192.168.1.10
Show packets from a specific source:
ip.src == 192.168.1.10
Show packets to a specific destination:
ip.dst == 192.168.1.20
Show traffic using TCP port 443:
tcp.port == 443
Show DNS queries:
dns.flags.response == 0
Show DNS responses:
dns.flags.response == 1
Show TCP SYN packets:
tcp.flags.syn == 1
Show TCP SYN packets without ACK:
tcp.flags.syn == 1 && tcp.flags.ack == 0
Show TCP retransmissions:
tcp.analysis.retransmission
Show TCP reset packets:
tcp.flags.reset == 1
Show packets containing an IP address and DNS traffic:
dns && ip.addr == 192.168.1.10
9.2 Capture Filter vs Display Filter
| Feature | Capture Filter | Display Filter |
|---|---|---|
| Applied | Before or during capture | After packets are captured |
| Purpose | Control what gets recorded | Control what is displayed |
| Syntax | BPF | Wireshark display-filter language |
| Can hide packets from capture file permanently? | Yes, excluded packets are not captured | No |
| Example | tcp port 443 | tcp.port == 443 |
Remember: Capture filters and display filters use different syntax. Do not assume a filter written for one will work in the other.
10. TCP Handshake Analysis
Understanding TCP is essential for packet analysis.
TCP establishes a connection using a three-way handshake.
<AsyncImage query="TCP three way handshake SYN SYN ACK ACK Wireshark packet sequence diagram" aspectRatio="16:9" width="100%"/>Step 1 – SYN
The client sends a SYN packet to initiate a TCP connection.
Step 2 – SYN-ACK
The server responds with SYN-ACK.
Step 3 – ACK
The client sends ACK.
The TCP connection is established.
10.1 What to Look for in Wireshark
Use:
tcp
Then inspect:
- Source IP.
- Destination IP.
- Source port.
- Destination port.
- SYN flag.
- ACK flag.
- Sequence number.
- Acknowledgment number.
- Window size.
10.2 Useful TCP Display Filters
SYN without ACK:
tcp.flags.syn == 1 && tcp.flags.ack == 0
SYN-ACK:
tcp.flags.syn == 1 && tcp.flags.ack == 1
RST:
tcp.flags.reset == 1
FIN:
tcp.flags.fin == 1
Retransmissions:
tcp.analysis.retransmission
Duplicate ACKs:
tcp.analysis.duplicate_ack
10.3 TCP Problems You May Observe
Retransmissions
A sender retransmits data when acknowledgments are not received as expected.
Possible causes include:
- Packet loss.
- Congestion.
- Network instability.
- Delayed acknowledgments.
- Capture limitations.
Duplicate ACKs
A receiver sends repeated acknowledgments indicating that it is still expecting particular data.
These can be associated with packet loss or out-of-order delivery.
Connection resets
A TCP RST can terminate a connection unexpectedly.
Possible reasons include:
- Application behavior.
- Firewall policies.
- Connection errors.
- Service availability problems.
Important: A single retransmission or reset does not prove a cyberattack. Investigate surrounding traffic and system logs.
11. DNS Packet Analysis
DNS is essential for translating domain names into IP addresses.
Packet analysis helps security teams understand DNS requests and responses.
11.1 Normal DNS Query Flow
Suppose a client wants to access:
www.example.com
The process is:
- The client checks available DNS caches.
- If necessary, it sends a DNS query to its configured resolver.
- The resolver processes the request.
- The resolver returns an answer or another appropriate response.
- The client uses the result to connect to the destination.
11.2 Common DNS Record Types
| Record | Purpose |
|---|---|
| A | Maps a name to an IPv4 address |
| AAAA | Maps a name to an IPv6 address |
| CNAME | Provides an alias for another domain name |
| MX | Identifies mail exchange servers |
| NS | Identifies authoritative name servers |
| TXT | Stores text information, often used for verification and email security |
| PTR | Supports reverse DNS lookups |
| SOA | Contains zone authority information |
11.3 Wireshark DNS Filters
Show DNS traffic:
dns
Show DNS queries:
dns.flags.response == 0
Show DNS responses:
dns.flags.response == 1
Show A record queries:
dns.qry.type == 1
Show AAAA record queries:
dns.qry.type == 28
Show DNS responses with errors:
dns.flags.rcode != 0
11.4 What Should an Analyst Investigate?
- Repeated queries for non-existent domains.
- Unusually frequent DNS requests.
- Unexpected DNS servers.
- Large numbers of unique domains.
- Unusual DNS record types.
- Unexpected DNS response codes.
- Suspicious domain names.
- Unusual DNS traffic volume.
These patterns may indicate misconfiguration, malware, tunneling, or normal application behavior. Context is essential.
11.5 DNS over HTTPS and DNS over TLS
Modern DNS communication may be encrypted.
DNS over HTTPS (DoH) carries DNS queries over HTTPS.
DNS over TLS (DoT) carries DNS queries over TLS.
This improves confidentiality between the client and resolver, but it can reduce visibility for network monitoring systems that rely only on traditional port 53 DNS traffic.
Organizations should establish appropriate DNS policies and monitoring controls.
12. HTTP and TLS Metadata Analysis
12.1 HTTP
HTTP is an application-layer protocol used for web communication.
Traditional HTTP commonly uses TCP port 80.
HTTP messages may include:
- Request method.
- Request path.
- Host information.
- Headers.
- Status code.
- Message body.
Common HTTP methods include:
| Method | Purpose |
|---|---|
| GET | Retrieve a resource |
| POST | Submit data |
| PUT | Create or replace a resource |
| PATCH | Partially update a resource |
| DELETE | Request resource deletion |
Common HTTP Status Codes
| Status | Meaning |
|---|---|
| 200 | OK |
| 301 | Moved Permanently |
| 302 | Found / temporary redirect |
| 400 | Bad Request |
| 401 | Unauthorized |
| 403 | Forbidden |
| 404 | Not Found |
| 429 | Too Many Requests |
| 500 | Internal Server Error |
| 502 | Bad Gateway |
| 503 | Service Unavailable |
HTTP Security Considerations
Traditional HTTP does not encrypt application communication.
Depending on the network path, an observer may be able to read request and response content.
Sensitive applications should use HTTPS.
12.2 HTTPS and TLS
HTTPS is HTTP protected using TLS.
TLS provides:
- Confidentiality through encryption.
- Integrity protection.
- Server authentication through certificate validation.
TLS can also support client authentication in appropriately configured environments.
<AsyncImage query="TLS handshake client server certificate key exchange encrypted application data diagram" aspectRatio="16:9" width="100%"/>12.3 What Can Wireshark Show in TLS Traffic?
Even when application data is encrypted, a packet capture may reveal some connection metadata.
Depending on the TLS version, configuration, and capture location, an analyst may observe:
- Source and destination IP addresses.
- Ports.
- Connection timing.
- Packet sizes.
- TLS record types.
- Handshake messages.
- Certificate information in some handshakes.
- Negotiated protocol information where visible.
Modern TLS features, including TLS 1.3 and Encrypted Client Hello where deployed, limit visibility into certain handshake details.
12.4 What Does Encryption Hide?
A correctly protected TLS connection generally prevents an ordinary network observer from reading the protected application payload.
For example, the observer generally cannot directly read:
- Login passwords.
- Private messages.
- Payment details.
- Protected application data.
Important: Encryption does not hide all metadata, and it does not make a compromised endpoint safe.
13. Network Logs
Network logs record events related to network devices, services, and communication.
They help security teams investigate performance problems and security incidents.
13.1 Common Log Sources
Firewall logs
Record permitted and blocked network connections.
Router logs
Record routing, interface, and device events.
Switch logs
Record port changes, link events, and security violations.
DNS logs
Record DNS queries and responses where logging is enabled.
DHCP logs
Record address allocation and lease events.
VPN logs
Record remote-access authentication and session information.
Server logs
Record application connections, errors, and service activity.
13.2 Example Firewall Log
2026-11-03 10:15:20
Source: 192.168.10.25
Destination: 203.0.113.20
Protocol: TCP
Destination Port: 443
Action: ALLOW
Interpretation:
A device at 192.168.10.25 connected to an external example IP using TCP port 443.
This alone does not prove the connection is malicious.
13.3 Example Firewall Deny Log
2026-11-03 10:16:10
Source: 192.168.10.25
Destination: 192.168.20.50
Protocol: TCP
Destination Port: 445
Action: DENY
Interpretation:
The firewall blocked an SMB-related connection from one internal network to another.
An analyst should verify whether this was an expected connection or a suspicious access attempt.
13.4 What Should Logs Contain?
Useful log fields include:
- Timestamp.
- Source IP.
- Destination IP.
- Source port.
- Destination port.
- Protocol.
- Action.
- Device identity.
- Event identifier.
- User identity where available.
Accurate timestamps and centralized log collection are important for incident investigation.
14. NetFlow Concepts
NetFlow is a network traffic monitoring technology originally developed by Cisco and widely associated with flow-based network analysis.
Rather than storing every packet, flow monitoring summarizes communication between endpoints.
14.1 What Is a Network Flow?
A flow represents a group of packets sharing a set of characteristics.
A commonly used flow key includes:
- Source IP.
- Destination IP.
- Source port.
- Destination port.
- Transport protocol.
Additional fields may be included depending on the exporter and flow format.
14.2 Example Flow Record
| Field | Value |
|---|---|
| Source IP | 192.168.10.25 |
| Destination IP | 203.0.113.20 |
| Source Port | 51500 |
| Destination Port | 443 |
| Protocol | TCP |
| Packets | 120 |
| Bytes | 85,000 |
| Duration | 35 seconds |
This record summarizes a communication flow.
The example addresses are documentation-only and do not represent real public systems.
14.3 Why Is NetFlow Useful?
It helps analysts identify:
- Top communicating devices.
- High-volume connections.
- Unusual external destinations.
- Unexpected protocols.
- Traffic spikes.
- Long-running communication.
- Potential data exfiltration patterns.
14.4 NetFlow vs Packet Capture
| Feature | Packet Capture | NetFlow |
|---|---|---|
| Data | Individual packets | Flow summaries |
| Payload visibility | May expose packet contents if unencrypted | Does not normally provide full packet payload |
| Storage | Can be large | Usually more compact |
| Analysis | Detailed protocol inspection | Traffic behavior and volume analysis |
| Best use | Deep investigation | Network-wide traffic visibility |
NetFlow is useful for identifying suspicious communication, while packet capture can provide more detailed evidence about selected traffic.
15. IPFIX Concepts
IPFIX stands for Internet Protocol Flow Information Export.
It is a standardized protocol for exporting flow information from network devices to collectors.
It is based on the flow-export concepts associated with NetFlow.
15.1 Main IPFIX Components
Exporter
The network device that observes traffic and exports flow records.
Collector
The system that receives exported records.
Analyzer
The platform that interprets the collected flow data.
15.2 NetFlow vs IPFIX
| Feature | NetFlow | IPFIX |
|---|---|---|
| Origin | Cisco-developed technology | IETF standard |
| Purpose | Flow monitoring | Flow information export |
| Data model | Depends on NetFlow version | Template-based information model |
| Vendor interoperability | Varies by implementation | Designed for standardization |
| Typical use | Network traffic visibility | Multi-vendor flow monitoring |
15.3 How Flow Monitoring Helps Security Teams
Imagine an employee computer normally sends a small amount of data to external web services.
Suddenly, it sends a large volume of outbound traffic to an unfamiliar destination.
Flow monitoring may help identify:
- The source device.
- The destination.
- The volume of traffic.
- The communication duration.
- The protocol and ports.
The security team can then investigate the device and use packet captures or endpoint logs for deeper analysis.
16. Detecting Unusual Network Traffic Patterns
Unusual traffic does not automatically mean an attack.
It means the activity differs from expected behavior and deserves investigation.
16.1 High Traffic Volume
Possible indicators:
- Sudden bandwidth spikes.
- Unexpected outbound transfers.
- Repeated large downloads.
- Unusual traffic during non-business hours.
Possible explanations:
- Backups.
- Software updates.
- Legitimate business transfers.
- DDoS activity.
- Data exfiltration.
16.2 Unusual DNS Activity
Possible indicators:
- Large numbers of unique domain queries.
- Repeated failed DNS requests.
- Unexpected DNS resolvers.
- Unusual DNS query patterns.
- Frequent requests to suspicious domains.
Possible explanations:
- Misconfigured applications.
- Malware communication.
- DNS tunneling.
- Software behavior.
16.3 Unusual Port Activity
Possible indicators:
- Unexpected connections to administrative services.
- Internal systems communicating with unnecessary ports.
- Unexpected database connections.
- New services appearing on critical servers.
Possible explanations:
- Legitimate configuration changes.
- Vulnerability scanning.
- Unauthorized service discovery.
- Compromised systems.
16.4 Repeated Failed Connections
Possible indicators:
- Many failed login attempts.
- Repeated connection attempts to unavailable services.
- High numbers of refused connections.
- Unusual authentication activity.
Possible explanations:
- Misconfigured software.
- Expired credentials.
- Network failures.
- Password attacks.
- Unauthorized reconnaissance.
16.5 Unusual Internal Communication
Possible indicators:
- Employee devices communicating with unexpected servers.
- Servers connecting to other network zones without a business reason.
- Unexpected administrative connections.
- Unusual east-west traffic.
Possible explanations:
- New applications.
- Management activity.
- Malware propagation.
- Lateral movement.
16.6 Possible Data Exfiltration
Data exfiltration is the unauthorized transfer of data out of an organization.
Possible indicators include:
- Large outbound data transfers.
- Unusual destination networks.
- Unexpected cloud storage usage.
- Data transfer outside business hours.
- Unusual traffic from sensitive servers.
A large transfer alone does not prove data theft. The analyst must validate the source, destination, business purpose, and endpoint activity.
17. Common Monitoring Metrics
Security teams use multiple measurements to understand network health and security.
| Metric | What It Measures |
|---|---|
| Bandwidth utilization | Percentage of available link capacity being used |
| Throughput | Actual data transfer rate |
| Latency | Time taken for data to travel |
| Packet loss | Percentage of packets not successfully delivered |
| Jitter | Variation in packet delay |
| Connection count | Number of active connections |
| Error rate | Frequency of network or application errors |
| Retransmission rate | Frequency of TCP retransmissions |
| DNS response time | Time taken to receive DNS answers |
| Interface errors | Errors reported by network interfaces |
Why Do These Metrics Matter?
Example:
A video conferencing application may experience poor quality because of:
- High latency.
- High jitter.
- Packet loss.
- Congested network links.
A database application may experience delays due to:
- Slow server responses.
- Packet retransmissions.
- Network bottlenecks.
- Firewall inspection delays.
Monitoring helps identify the area that needs further investigation.
18. Practical Lab 1: Capture Your Own Network Traffic
Objective: Capture normal network traffic using Wireshark.
Requirements
- Wireshark installed.
- Your own computer.
- An authorized network connection.
Steps
- Open Wireshark.
- Identify your active network interface.
- Select the interface.
- Start packet capture.
- Open a familiar website.
- Wait for the page to load.
- Stop packet capture.
- Inspect the captured traffic.
Observe
- Source IP.
- Destination IP.
- Protocol.
- Packet length.
- DNS queries.
- TCP connections.
- TLS handshakes.
Questions
- Which protocols appeared?
- Did DNS queries occur?
- Did the browser establish TCP connections?
- Was HTTPS used?
- Which packet contained the first SYN?
- Which packet completed the TCP handshake?
Expected outcome: Understand the basic packet capture workflow.
19. Practical Lab 2: Practice Display Filters
Objective: Filter captured packets using Wireshark.
Open a capture file generated from your own browsing or an approved training environment.
Try these filters:
DNS traffic
dns
TCP traffic
tcp
TLS traffic
tls
Specific host
ip.addr == 192.168.1.10
TCP port 443
tcp.port == 443
DNS queries
dns.flags.response == 0
DNS responses
dns.flags.response == 1
TCP SYN packets
tcp.flags.syn == 1 && tcp.flags.ack == 0
TCP retransmissions
tcp.analysis.retransmission
Tasks
- Apply each filter.
- Record the number of displayed packets.
- Select one packet.
- Expand its protocol layers.
- Explain what the packet represents.
Expected outcome: Become comfortable filtering and inspecting packet captures.
20. Practical Lab 3: Analyze a TCP Handshake
Objective: Identify the TCP three-way handshake.
Steps
- Open an authorized packet capture containing TCP communication.
- Apply:
tcp.flags.syn == 1
- Identify a SYN packet.
- Find the corresponding SYN-ACK.
- Identify the final ACK.
- Record the source and destination ports.
Record Your Findings
| Packet | TCP Flags | Purpose |
|---|---|---|
| 1 | SYN | Client requests connection |
| 2 | SYN, ACK | Server responds |
| 3 | ACK | Client confirms |
Questions
- Why does TCP use a three-way handshake?
- What happens if the server does not respond?
- What does a TCP RST indicate?
- Why might retransmissions occur?
Expected outcome: Understand how normal TCP connections are established.
21. Practical Lab 4: DNS Traffic Investigation
Objective: Understand DNS queries and responses.
Steps
- Start an authorized Wireshark capture.
- Open a website or perform a normal DNS lookup.
- Apply:
dns
- Select a DNS query.
- Identify the queried domain.
- Inspect the query type.
- Find the corresponding response.
- Identify the response code and returned records.
Questions
- Was the query for an A or AAAA record?
- Which DNS server received the query?
- Was the response successful?
- Did the response contain an IP address?
- What could repeated DNS failures indicate?
Expected outcome: Learn how to investigate DNS communication.
22. Practical Lab 5: Build a Basic Traffic Baseline
Objective: Understand normal network activity.
Use your own device or an authorized lab environment.
Collect These Measurements
| Metric | Observation |
|---|---|
| Total packets | |
| Total captured bytes | |
| Most common protocol | |
| Common destination | |
| Common destination port | |
| DNS request count | |
| TCP connection count | |
| Largest observed transfer | |
| Capture duration |
Tasks
- Capture traffic during normal browsing.
- Record the metrics.
- Repeat during a different normal activity, such as an authorized software update.
- Compare both captures.
- Identify which changes are expected.
- Document unusual observations that require further investigation.
Expected outcome: Understand why normal traffic patterns must be established before identifying anomalies.
23. Practical Lab 6: NetFlow and IPFIX Investigation
Objective: Understand flow records using a simulated dataset.
Example Dataset
| Source | Destination | Protocol | Destination Port | Bytes |
|---|---|---|---|---|
| 192.168.10.10 | 203.0.113.10 | TCP | 443 | 25,000 |
| 192.168.10.11 | 203.0.113.20 | TCP | 443 | 32,000 |
| 192.168.10.12 | 192.168.20.10 | TCP | 445 | 12,000 |
| 192.168.10.13 | 198.51.100.20 | UDP | 53 | 800 |
| 192.168.10.14 | 203.0.113.30 | TCP | 443 | 8,500,000 |
All public-looking addresses in this dataset are documentation-only example addresses.
Tasks
- Identify the largest transfer.
- Identify internal communication.
- Identify DNS traffic.
- Compare the largest transfer with expected behavior.
- Identify what additional evidence would be required before declaring an incident.
Questions
- What is a network flow?
- How does flow monitoring differ from packet capture?
- Why is a large outbound transfer worth investigating?
- What information is missing from a basic flow record?
Expected outcome: Understand how flow data supports network-wide visibility.
24. Practical Lab 7: SOC Traffic Investigation Scenario
Objective: Investigate suspicious traffic using multiple data sources.
Scenario
A fictional organization reports that an employee computer is behaving unusually.
The monitoring system records:
10:00:00
Host: EMP-014
Event: Normal HTTPS browsing

10:05:00
Host: EMP-014
Event: Repeated DNS queries to unfamiliar domains

10:07:00
Host: EMP-014
Event: Multiple outbound connections to an unfamiliar IP

10:10:00
Host: EMP-014
Event: Large outbound data transfer

10:12:00
Host: EMP-014
Event: Endpoint monitoring alert
Investigation Tasks
- Identify the affected device.
- Establish the timeline.
- Identify the destination domains and IP addresses.
- Review DNS responses.
- Review connection metadata.
- Compare the activity with the traffic baseline.
- Check endpoint process information.
- Determine whether the transfer was authorized.
- Recommend containment if compromise is confirmed.
- Prepare an incident report.
Example Investigation Table
| Evidence | Question |
|---|---|
| DNS logs | Which domains were requested? |
| Firewall logs | Which connections were allowed? |
| Flow records | How much data was transferred? |
| Packet capture | Which protocols and connection patterns were observed? |
| EDR logs | Which process initiated communication? |
| Authentication logs | Which user was logged in? |
Expected outcome: Understand how SOC analysts combine packet, flow, endpoint, and log information.
25. Packet Analysis Best Practices
When investigating network traffic:
- Capture only traffic you are authorized to inspect.
- Define the investigation objective before capturing.
- Use appropriate capture filters.
- Avoid collecting unnecessary sensitive data.
- Protect packet capture files.
- Record capture timestamps and interfaces.
- Preserve original evidence.
- Use display filters for focused analysis.
- Correlate packet data with system logs.
- Avoid treating one packet as proof of an attack.
- Document assumptions and limitations.
Privacy Considerations
Packet captures may contain:
- Usernames.
- Internal addresses.
- Application metadata.
- Authentication information in insecure protocols.
- Sensitive business information.
Store captures securely and follow organizational data-handling requirements.
27. Lesson Summary
In this lesson, you learned:
- Network monitoring helps observe network activity and performance.
- Packet analysis examines individual captured packets.
- Network baselines describe expected communication patterns.
- Wireshark is used for protocol and packet analysis.
- Capture filters control which packets are recorded.
- Display filters control which captured packets are shown.
- TCP handshake analysis helps identify connection behavior.
- DNS packet analysis helps investigate name resolution.
- HTTP and TLS analysis reveals different levels of communication detail.
- Network logs provide evidence of device and service activity.
- NetFlow summarizes network communication.
- IPFIX standardizes flow information export.
- Traffic anomalies can indicate misconfiguration, attacks, or legitimate business activity.
- SOC analysts correlate network, endpoint, and identity information before reaching conclusions.
28. Key Terms to Remember
| Term | Meaning |
|---|---|
| Packet Analysis | Examination of captured network packets |
| Wireshark | Network protocol analyzer |
| Capture Filter | Filter applied during packet capture |
| Display Filter | Filter applied to captured packets |
| Baseline | Description of expected network behavior |
| TCP | Transmission Control Protocol |
| TLS | Transport Layer Security |
| DNS | Domain Name System |
| NetFlow | Flow-based network monitoring technology |
| IPFIX | Internet Protocol Flow Information Export |
| NIDS | Network-based Intrusion Detection System |
| SIEM | Security Information and Event Management |
| Throughput | Actual data transfer rate |
| Latency | Communication delay |
| Packet Loss | Packets that fail to reach their intended destination |
29. Coming Next: Network Security Architecture
In the next lesson, you will learn how organizations design secure networks using segmentation, DMZs, Zero Trust, least privilege, and defense in depth.
Topics include:
- Network segmentation.
- VLAN security.
- DMZ architecture.
- Zero Trust principles.
- Least privilege.
- Defense in depth.
- Public, private, and management zones.
- Secure network design.
- Cloud network security.
- Practical enterprise network architecture.
CYNARKS Academy – Learn to Understand. Practice to Defend.
Practice networking and security testing only on systems you own or have explicit authorization to test.
End of lesson
Quiz · Tasks · Labs
Pass the quiz (≥70%), check off tasks, then mark the lesson complete to earn Foundations badges.
Scenario check
Real situations — apply the lesson logic; avoid pure memorization.
Answer all, then submit1. What is network monitoring?
2. What is packet analysis?
3. What is a network traffic baseline?
4. What is Wireshark used for?
5. What is a capture filter used for?
6. What is a display filter used for?
7. Which display filter shows DNS packets?
8. Which display filter identifies TCP SYN packets without ACK?
9. What are the three steps of a TCP handshake?
10. What does a DNS A record contain?
11. What does an AAAA record provide?
12. What does HTTPS use to protect communication?
13. What does NetFlow primarily provide?
14. What is IPFIX?
15. Why are packet captures useful?
16. What can an unusually large outbound transfer indicate?
17. Which data source can help identify how much traffic a host transferred?
18. Why should packet capture files be protected?
19. Does encrypted HTTPS traffic mean all connection metadata is hidden?
20. Does an unusual traffic pattern automatically prove an attack?
Lesson tasks
Practice labs
Required labs test this lesson’s skills. Related labs are optional previews.
- RequiredTroubleshoot Path — Find the SYNNetworking
- RequiredPick the SYN PacketNetworking
Finish the quiz and tasks to unlock Mark as completed.